
Custom Dashboards for Real-Time KPI Analysis
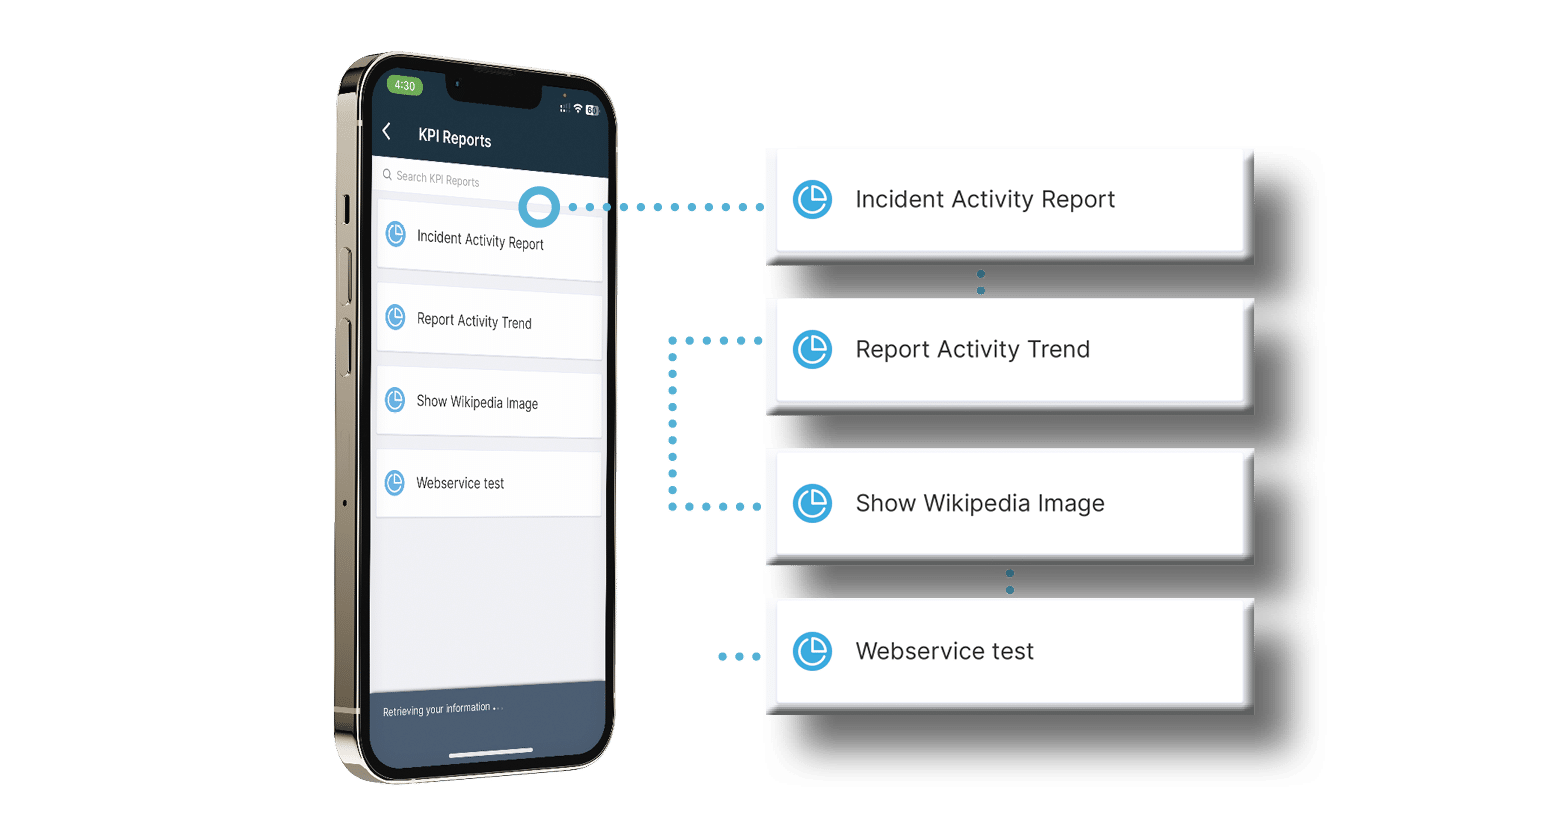
Monitor the metrics that matter most to your operation. Customize map-based dashboards to visualize incident locations, safety compliance, or team activity, all updated live from the field.
Features
With 1st Reporting’s Analytics and KPI Reporting, you can monitor performance, analyze incidents, and track key metrics all in one dashboard, in real time.

The problem
Whether you’re managing safety, operations, or compliance, incident reporting analysis and KPI tracking are critical. 1st Reporting helps you unlock the full value of your field data with powerful and customizable map-based dashboards, real-time trends, and export-ready reports so you can make smarter decisions, faster.
Monitor the metrics that matter most to your operation. Customize map-based dashboards to visualize incident locations, safety compliance, or team activity, all updated live from the field.
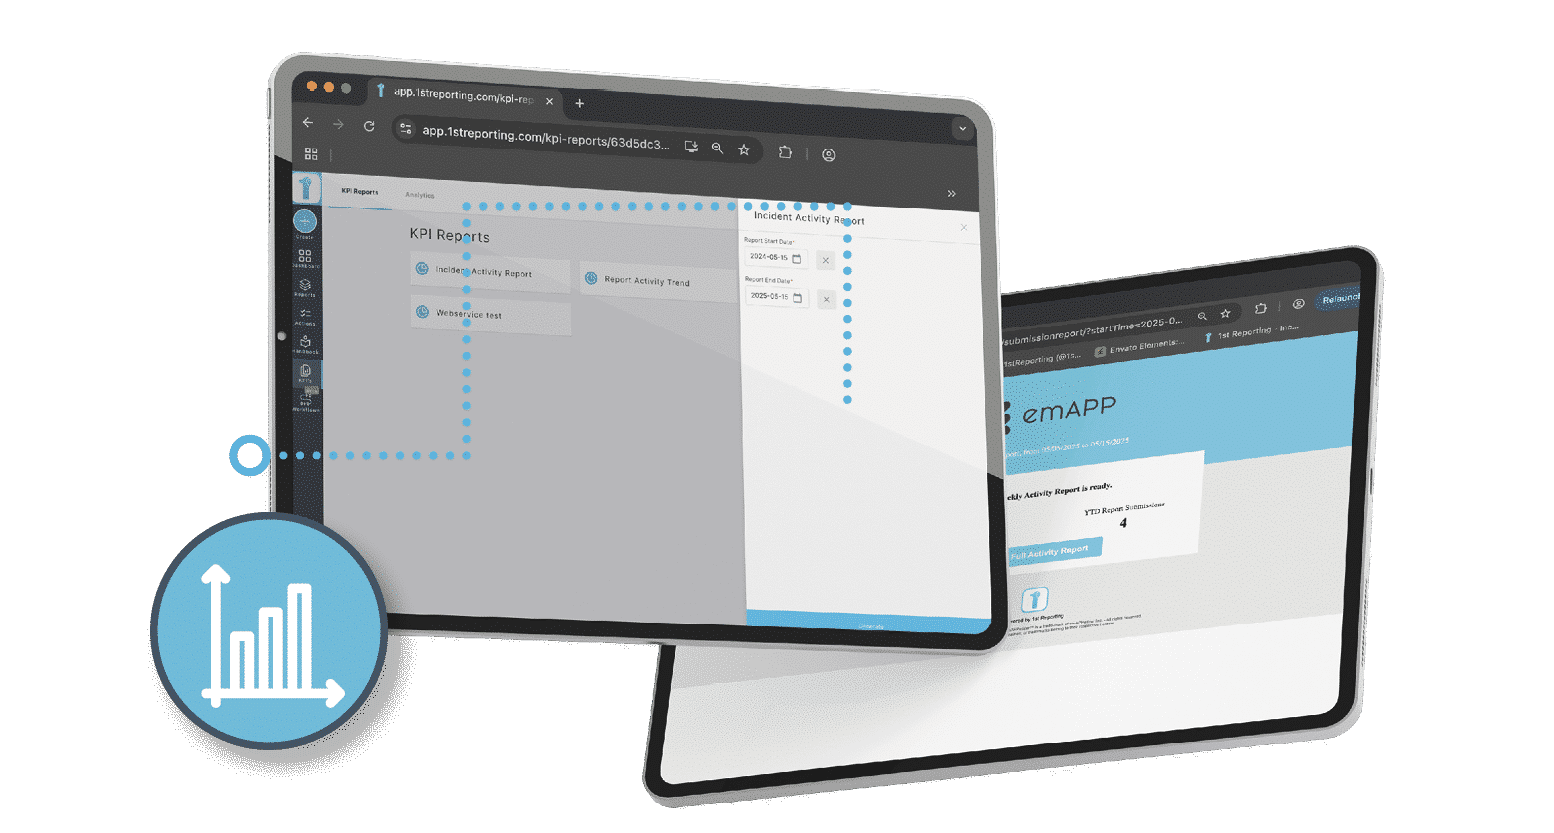
Use the built-in KPI reports to spot recurring issues, location-based risks, or behavior patterns before they escalate. Trend analysis tools help you move from reactive to proactive across your entire organization.
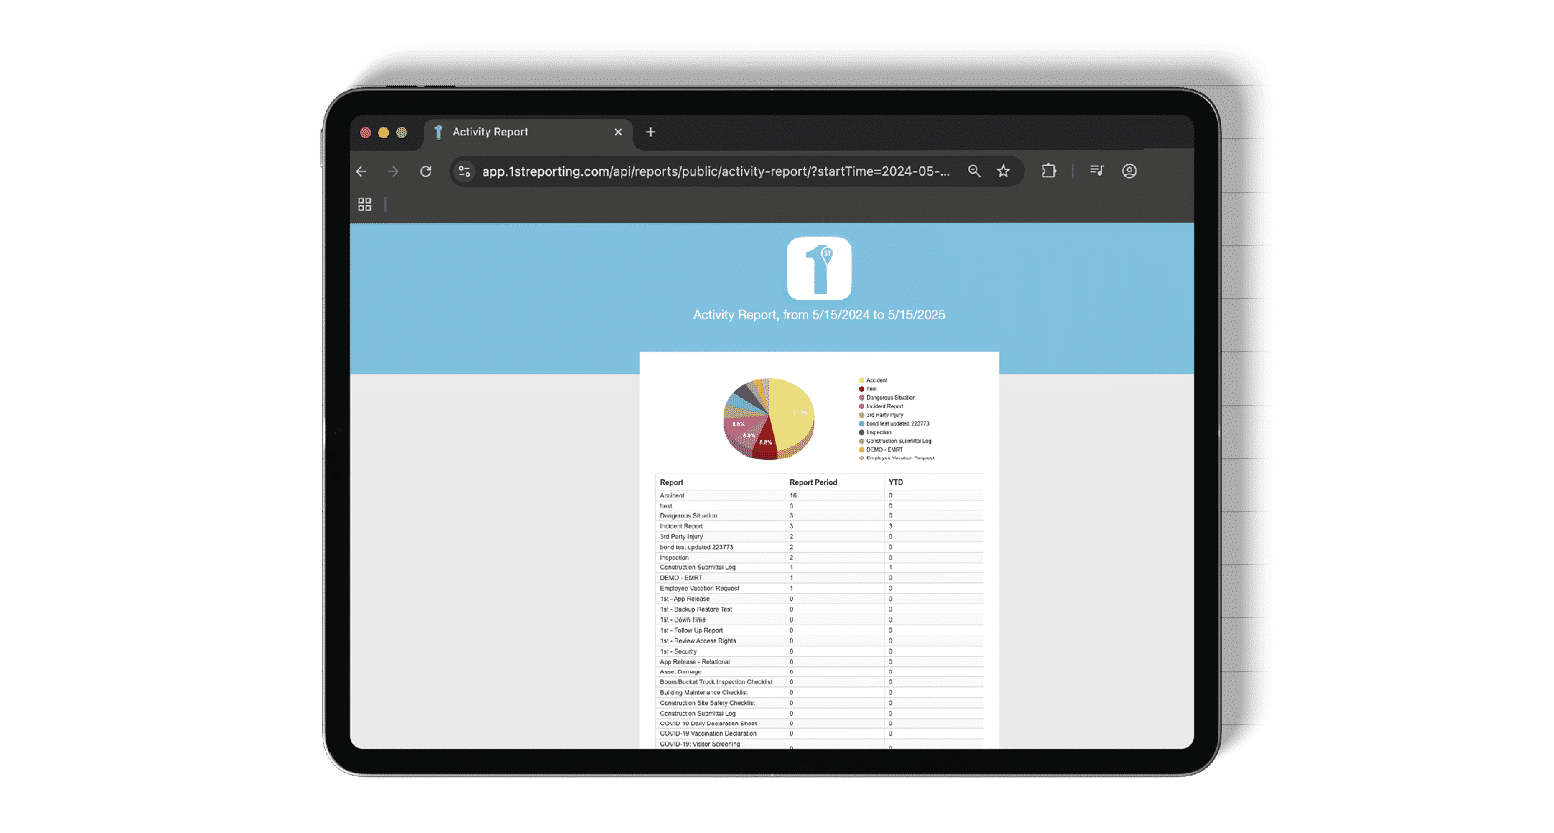
Ensure you’re always audit-ready. Monitor form submissions, safety reports, and protocol adherence to stay aligned with regulatory standards and internal policies.
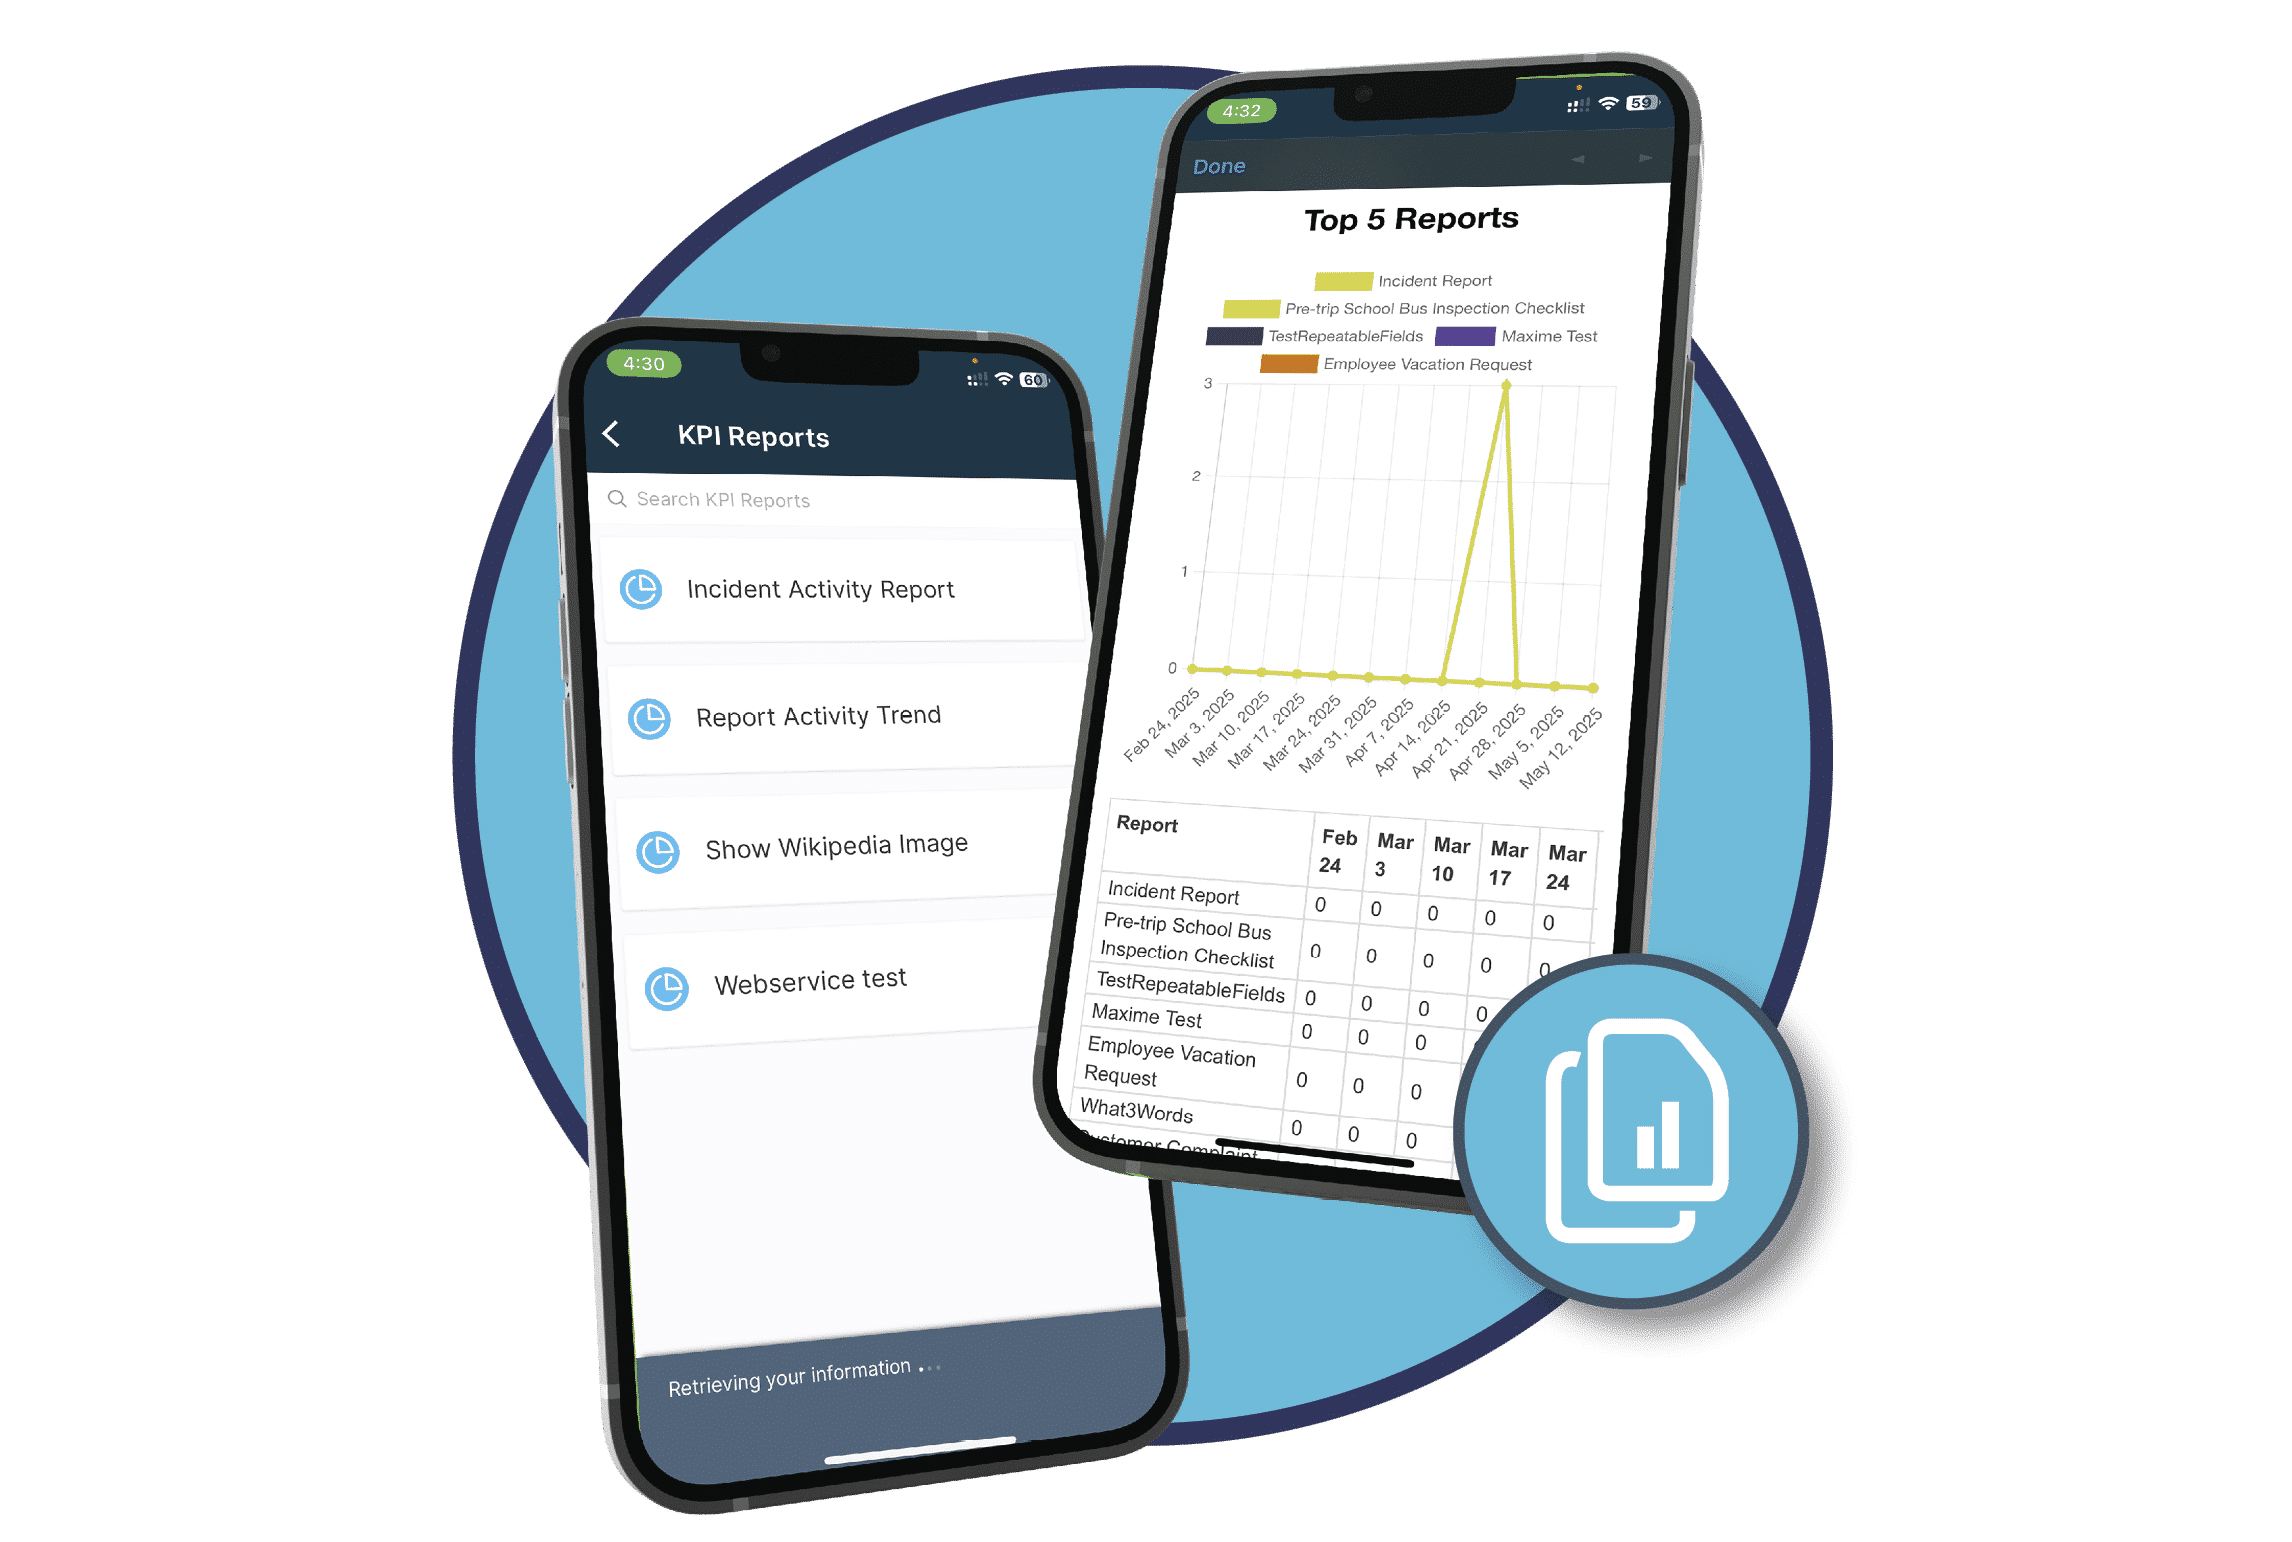
Whether you’re presenting to leadership or updating your field team, generate exportable reports in multiple formats. Share insights easily to align stakeholders and drive accountability. Work seamlessly with Microsoft Power BI® for visual trends and presentations.
Analytics are only useful when they’re usable. 1st Reporting delivers clear, mobile-friendly data views that empower both on-site teams and management to act with confidence.
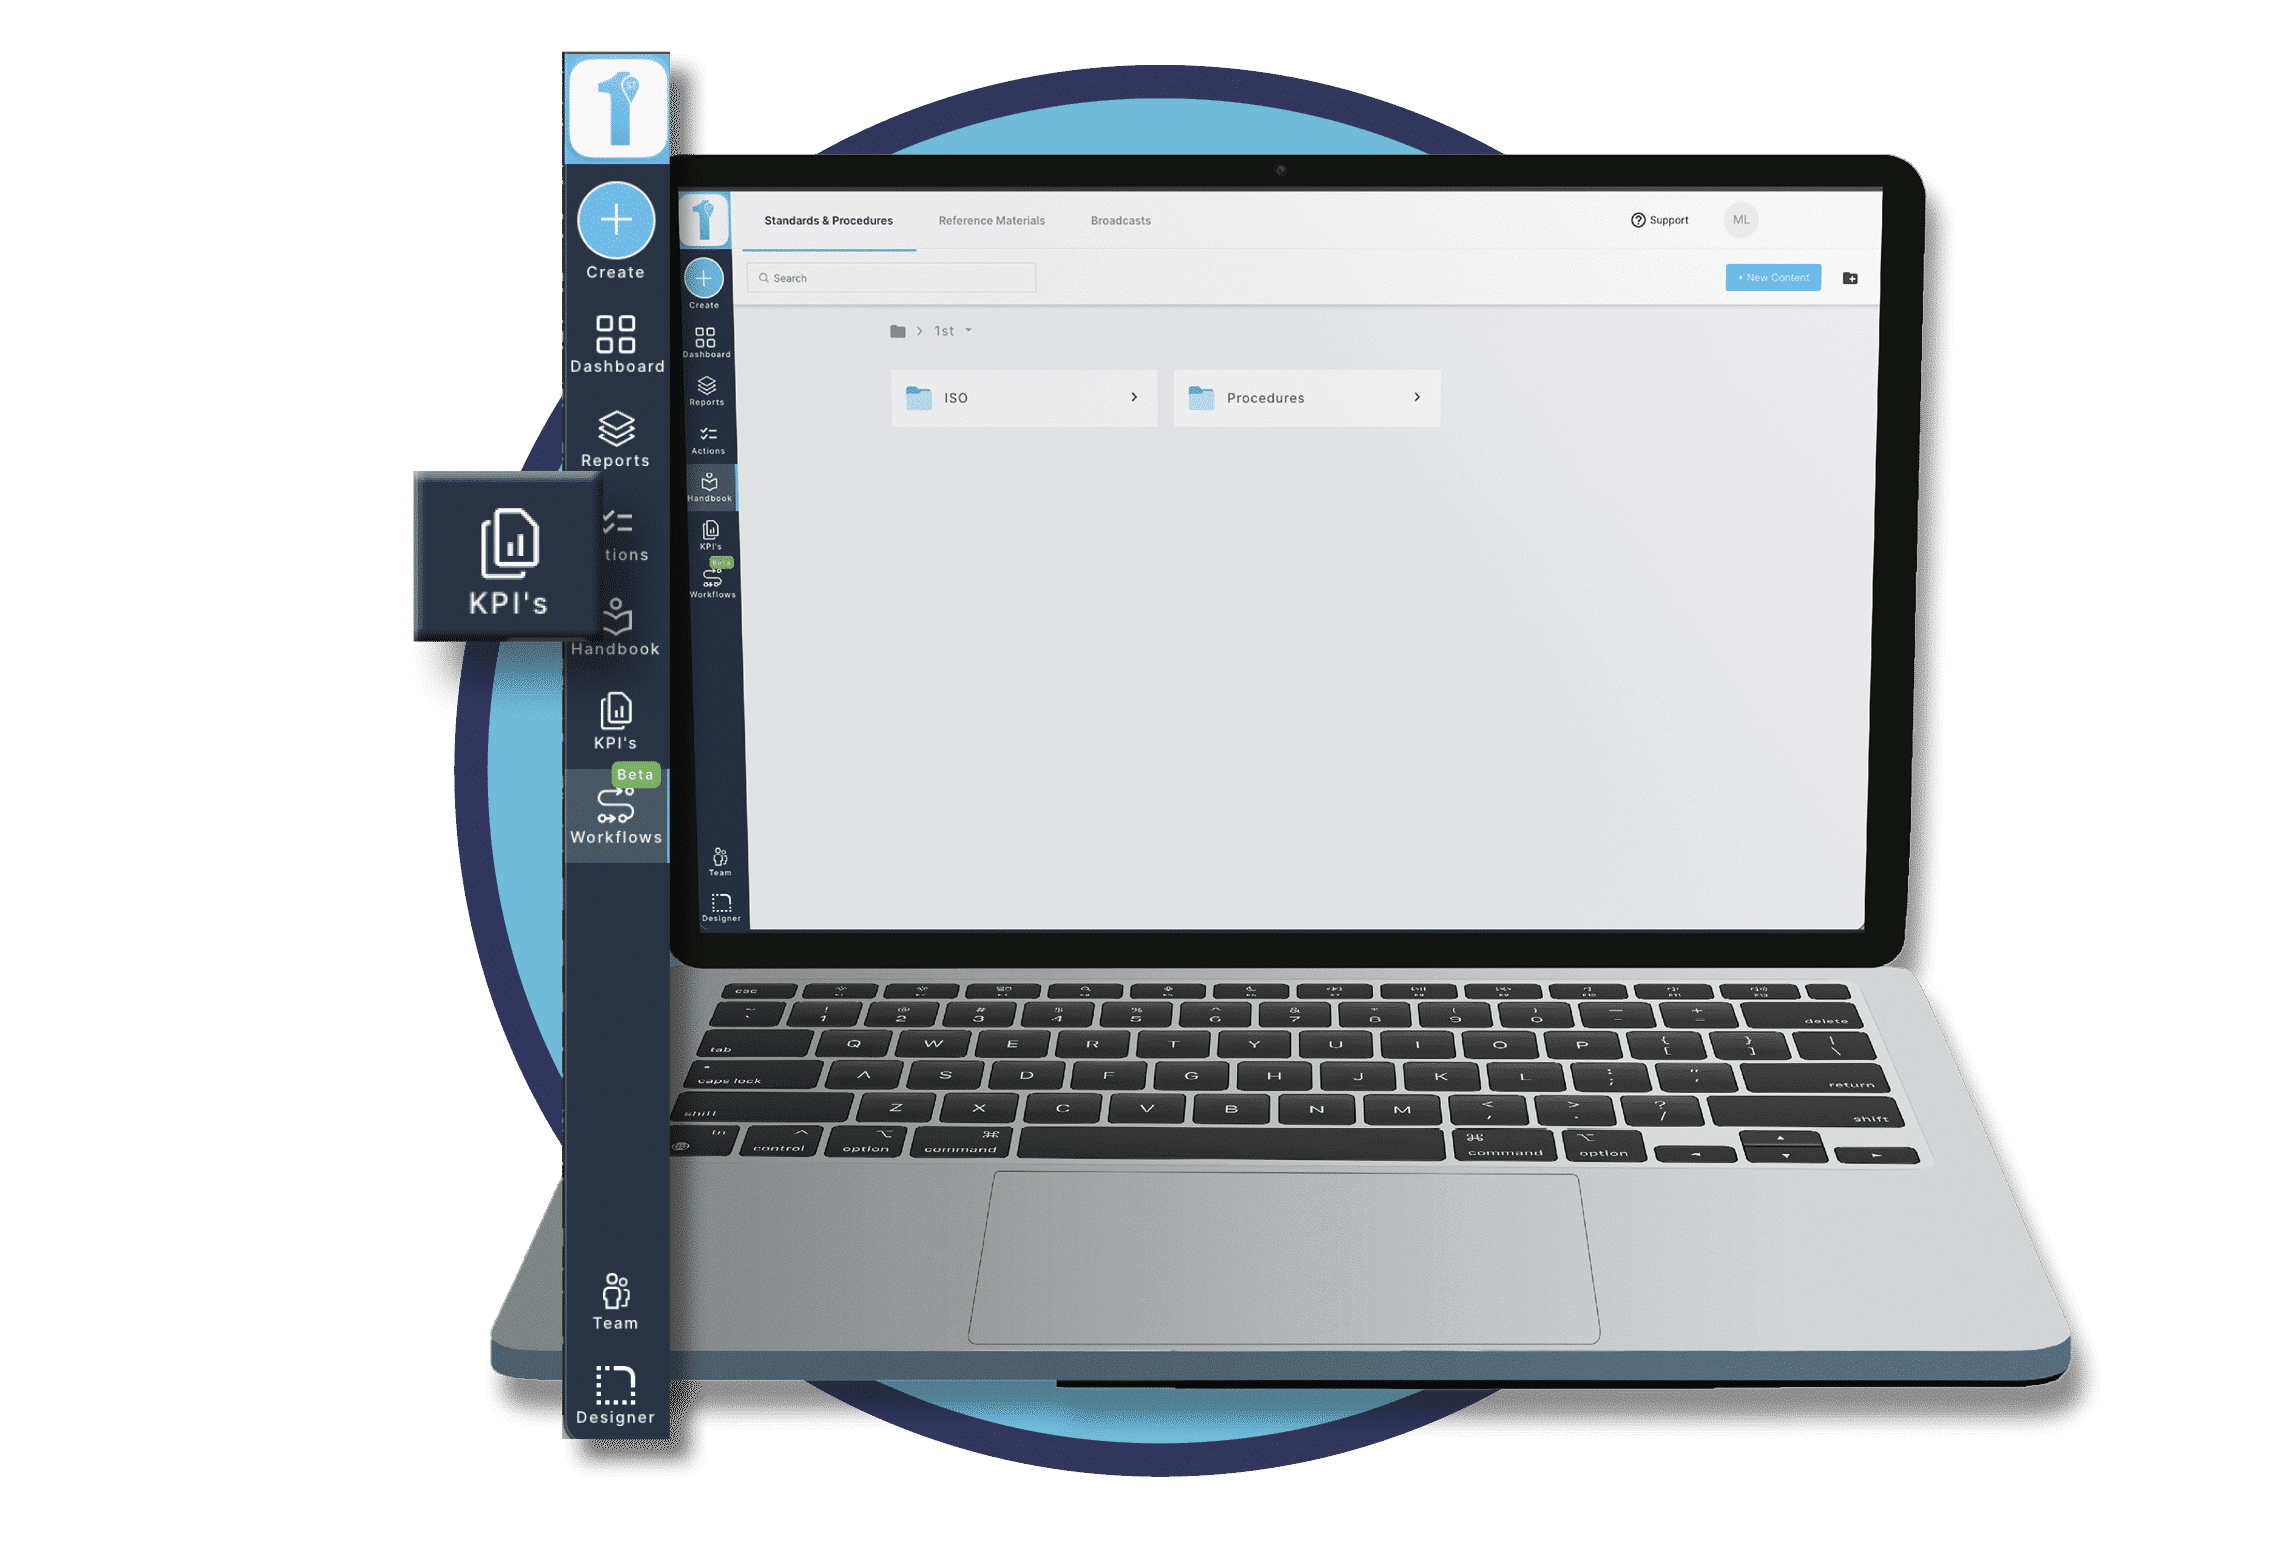
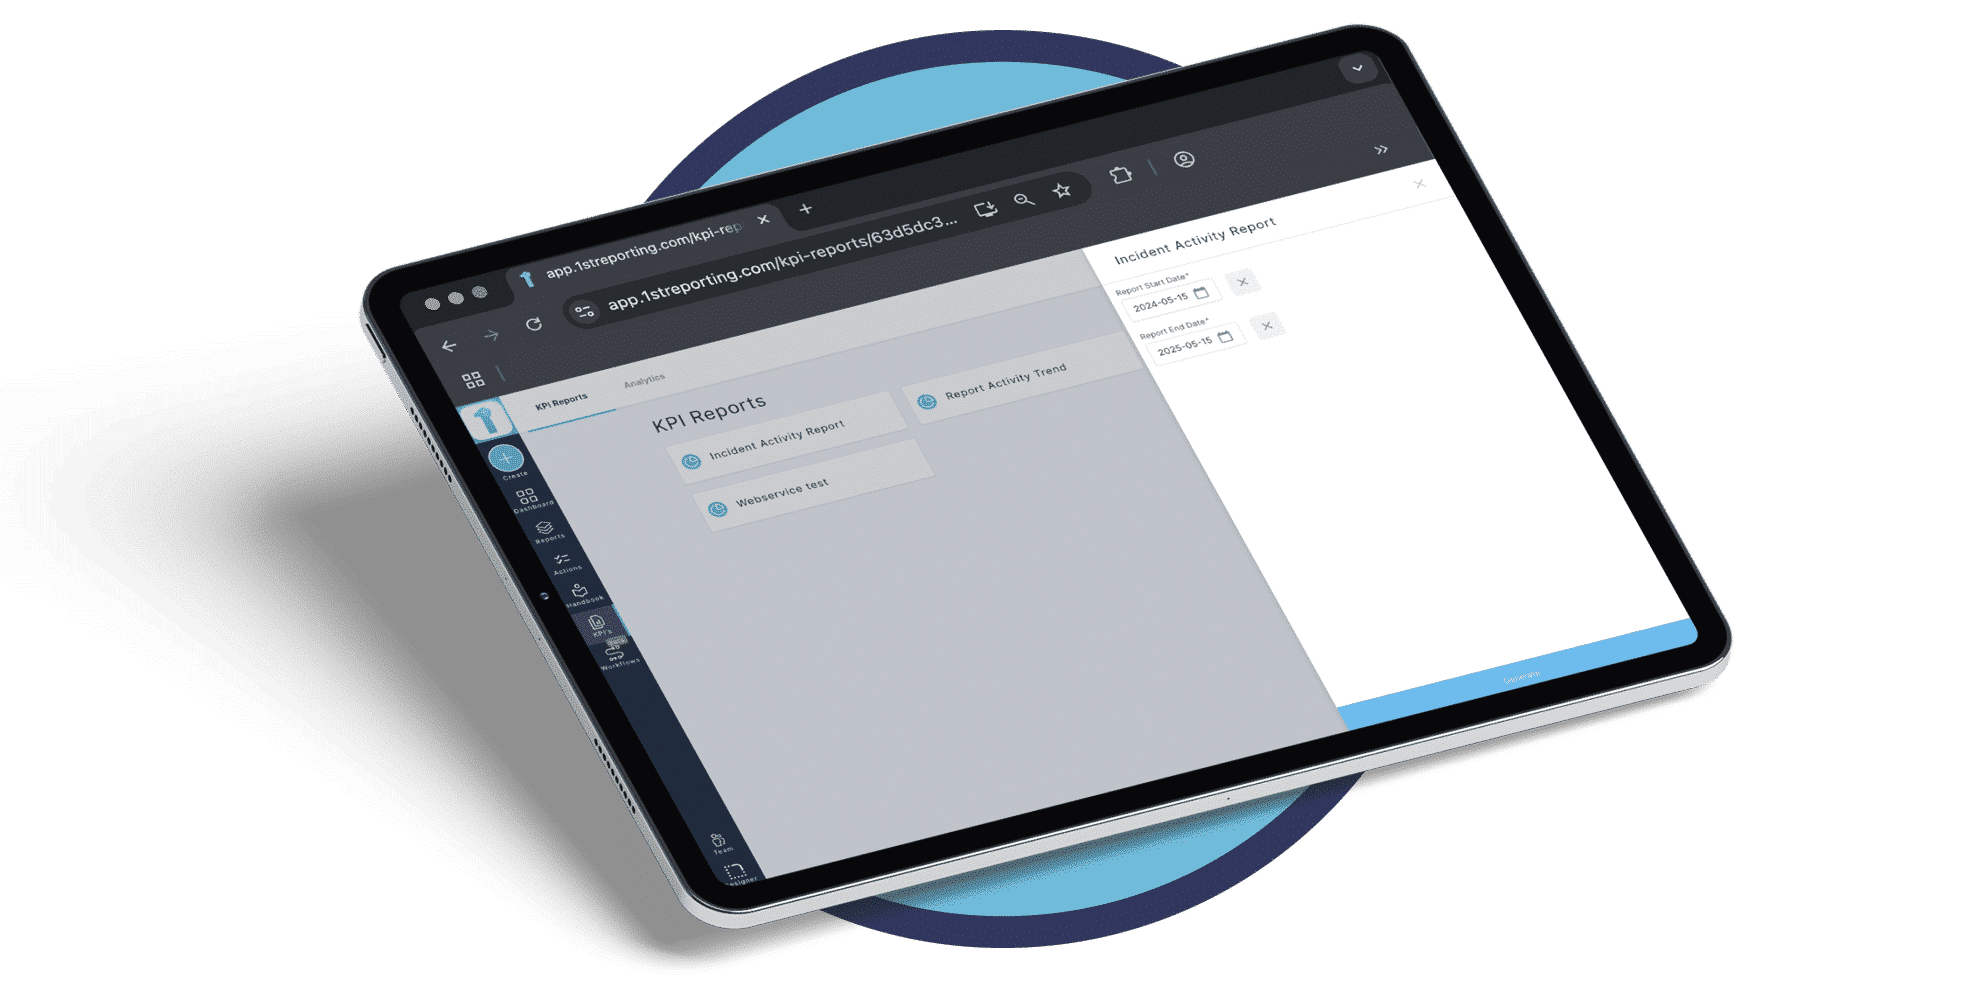
Stop guessing and start knowing. 1st Reporting gives you the tools to see what’s happening across your organization giving you data backed insights to decide what to do next. Drive your organization forward with the right data and even connect Microsoft Power BI® for deeper visual analysis.
Yes. You can select the specific metrics you want to track and arrange your report dashboard to match your reporting priorities. You can also contact our team of reporting specialists to create customized KPI reports to meet your organization’s needs.
Submitted reports are automatically logged and categorized, allowing you to spot patterns, analyze frequency, and identify root causes over time.
Absolutely. You can track report submissions, missed protocols, and more, making it easy to demonstrate compliance at any time.
It does. Your dashboards and reports reflect the latest field activity, ensuring you're always working with current information.
Yes. You have control over a customizable map-based dashboard where you can see exactly where each report was submitted.