
Imagine your enterprise harnessing the full potential of its data, outmaneuvering competitors with the precision of a master chess player. It isn’t just a scenario reserved for the likes of tech giants; it’s a reality that business intelligence (BI) tools can bring to your doorstep.
In the fast-paced arena of modern business, where data dictates decisions, BI stands not merely as an option but as a critical driver of strategic advantage. It’s your secret weapon, turning raw data into insightful action plans that drive your company forward.
Business Intelligence isn’t just about accessing information; it’s about transforming it into a strategic asset that fuels informed decision-making and innovation.
In this article, we’ll dissect how you can leverage BI tools not just to keep up but to set the pace in your industry. We’ll explore the multifaceted arsenal of BI, showcase success stories that demonstrate its transformative power, and provide you with actionable insights on implementing and benefiting from these technologies.
Join us as we unlock the power of BI tools, turning information into your enterprise’s competitive edge in a market where the only constant is change.
Understanding the Landscape of Business Intelligence Tools

A strong understanding of how the BI ecosystem functions will empower you so your team can glean even greater insights. These insights will help your organization shift and adapt to changes in the marketplace, competition, and other areas where typical historical analysis would take years. Now, with BI tools, you can answer in moments. Let’s start with what we mean by tools and what you might want to consider, depending on your required outcome.
Unpacking the BI Toolkit: What’s in Your Arsenal?
Empower your enterprise with a comprehensive suite of Business Intelligence tools designed to translate data into decisive action. Start by delving into the core components of a robust BI toolkit:
Data Analytics
Dive deep into your data lakes to fish out meaningful patterns and trends. Equip yourself with tools that not only analyze past performance but also unveil opportunities lying beneath the surface.
Reporting
Implement dynamic reporting systems that offer real-time insights, ensuring that every report informs action and is tailored to the specific needs of its readers.
Dashboards
BI tools typically allow you to construct customized, dynamic, and intuitive dashboards that serve as your enterprise’s control panel, presenting real-time metrics at a glance and enabling swift data-backed decision-making.
Customizability
Like ‘1st Reporting,’ your BI tool should offer bespoke form creation, ensuring that every data capture is as unique as your business needs.
Mobility
Choose tools that walk with you. Mobile accessibility means your team is always ready to document, analyze, and act—anytime, anywhere.
Cloud Storage
Ensure that your BI tool harnesses the power of the cloud, facilitating seamless access to data across your organization, just like the cloud functionality of ‘1st Reporting’.
The Strategic Role of BI in Modern Business

Today’s organizations don’t have time to wait for long, drawn studies, not in the age of AI and big data. Our computers are much faster than they were twenty years ago, and they are much more capable. Furthermore, the software has come a long way, and now, gleaning insights from data is easier and faster than ever before.
Beyond Data: BI as Your Strategic Ally
Business intelligence in our fast-paced society is critical for organizational evolution and adaptation to a changing business landscape. In fact, according to Josh Howarth of Exploding Topics(1), today’s average company uses 3.8 business intelligence solutions. If your team isn’t, you can be sure your competition is using them.
Business intelligence tools are giving organizations a competitive advantage in the marketplace, ensuring future-proof business continuity. The contribution that trend analysis in data analytics can provide can shape not only your BI strategy but also business performance in general.
Using technologies like predictive analytics drives intelligent data-driven decision-making. Decision-making that only a robust BI integration can enable for best organizational and business performance.
BI’s contribution to strategic process formulation and decision-making is unmatched and unrivaled. No type of software helps businesses more by enabling data-driven decision-making processes.
In the following chart, my analysis of a study(2) of how BI tool implementation affects organizational performance.
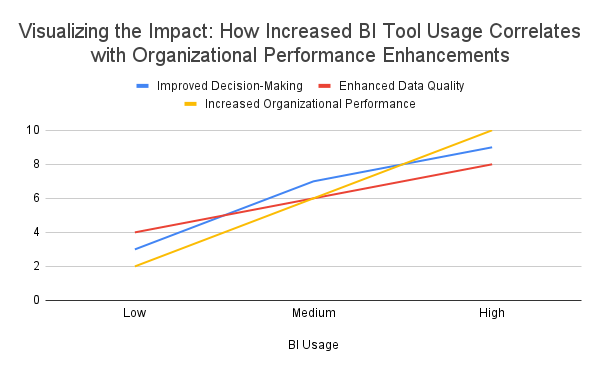
My analysis and subsequent determination following the study is that there is a notable improvement across various sectors of organizational methodology and practice with the adoption and use of business intelligence tools.
The graph presented here visualizes the impact of Business Intelligence (BI) tool usage on organizational performance as derived from qualitative findings. The scales used are representative and aim to illustrate the positive correlation between the extent of BI tool integration and the improvements in decision-making, data quality, and overall organizational performance. Actual performance improvements will vary among different organizations, and you should measure them with precision.
Getting Started: Collecting and Preparing Your Data

In order to get started with a strategic approach to business intelligence tools integrations, we need to determine an appropriate framework that your team can adopt. Some of the decisions and functions will obviously be different for your organization, but we’ll pursue a fundamental framework generally used to get started.
Laying the Groundwork: Data Collection and Management
Two primary factors are directly relative to the success of your business intelligence proposition: data in and data out. Or, to be more technical, data collection and data cleansing.
Data Collection
Data collection is the process of receiving information and collecting, transcribing, or committing it to some form of retrievable memory storage for later analysis. The larger the sample base, the more accurate the subsequent trends and findings will be. In simple terms, the more data, the better.
Data Cleansing
Data cleansing is the process of removing data that, for whatever reason, is no longer useful or relevant. By removing or ‘cleansing’ your data, you strive to maintain more accurate and more relevant results.
Data Cleansing 101
Data cleansing is critical in maintaining the quality of your data, which directly impacts the effectiveness of your business intelligence tools. Here are three actionable tips you can incorporate into your data cleansing process:
Establish a Clear Data Quality Plan
Start by defining what quality data means for your specific context. Determine the critical dimensions of data quality relevant to your needs, such as accuracy, completeness, consistency, and timeliness. Outline the standards and procedures for how your team should collect data, store it, and maintain it. Make sure you document this plan, add it to relevant standard operating procedures (SOP), and communicate it across your team to ensure uniform adherence.
Utilize Automated Tools with Manual Oversight
Implement software that automates the process of scanning for and correcting errors in large datasets. However, there’s a catch: do not rely solely on automation. Combine these tools with manual reviews, particularly in areas where context and decision-making are crucial. This hybrid approach ensures a thorough cleansing process, catching errors that automated systems might miss and adding a layer of qualitative review.
Regularly Update and Refresh Data
Schedule regular maintenance and updates to your data. Stale data can be as detrimental as incorrect data. Please keep track of when your team last updated the data and refresh it periodically to reflect the most current information. This action includes removing duplicates, correcting discrepancies, and updating outdated information. Regular audits of your data will ensure ongoing cleanliness and usability.
Remember, a clean database is a powerful asset, enabling you to make more informed decisions, understand your customers better, and improve the accuracy of your business intelligence insights.
Real-World Industry Examples of BI in Action

You can see examples of business intelligence (BI) tools widely used across various industries to enhance decision-making, optimize processes, improve customer satisfaction, and gain a competitive advantage. Here are some real-world examples illustrating how BI tools are put into action per industry vertical:
Retail – Sales and Inventory Management
Many successful big-box retail chains use BI tools to analyze sales data and inventory levels in real time. For example, by using BI dashboards, one can track which products are selling well and which are not, enabling an organization to adjust procurement and stock levels accordingly. This data helps avoid overstocking and understocking and can significantly improve profit margins and cash flow.
Healthcare – Patient Care and Hospital Management
Hospitals employ BI tools to monitor and analyze patient data, treatment outcomes, and hospital operations. Medical facilities and related operations can use this data to identify patterns, such as which treatments are most effective for specific conditions or where there may be bottlenecks in patient flow. As a result, they can enhance patient care, streamline operations, and reduce costs.
Finance – Risk Management and Investment Decisions
Financial institutions often utilize BI tools for risk analysis, assessing the creditworthiness of clients, and detecting potential fraud. They can also analyze market trends and customer data to make informed investment decisions and tailor financial products to the needs of their customers.
Manufacturing – Supply Chain Optimization and Quality Control
Manufacturers apply BI tools to monitor every aspect of their supply chain, from inventory levels and supplier performance to production cycle times and quality control metrics. By analyzing this data, they can identify inefficiencies, anticipate potential disruptions, and improve product quality.
E-Commerce – Customer Behavior Analysis
E-commerce platforms use BI tools to track and analyze customer behavior, such as purchase history, product views, and cart abandonment rates. This data collection process enables organizations and businesses to personalize marketing campaigns, recommend products, and improve the customer experience. All, of course, are backed by intelligent data-driven decisions.
Marketing – Campaign Analysis and Customer Insights
Marketers leverage BI tools to measure the effectiveness of their campaigns across different channels. By understanding which campaigns are driving engagement and sales, they can allocate their budgets more effectively and increase ROI. BI tools also help them segment their audience and tailor messages to different customer groups based on behavior and preferences.
Human Resources – Workforce Analytics
HR departments use BI tools to analyze team member data, including performance, attendance, and satisfaction levels. Processing HR data in this way helps HR professionals identify trends, such as which benefits contribute most to team member retention or which training programs are most effective at improving performance.
These examples demonstrate how BI tools can provide actionable insights into various aspects of business, allowing organizations to act more strategically and efficiently.
No matter the industry, if there’s data, there’s a need to present it in a way that fellow decision-makers and stakeholders can understand. It’s a necessity if an organization intends to thrive. According to Andrew Chen(3), formerly Head of Rider Growth at Uber,
“Have a vision for what you are trying to do. Use data to validate and help you navigate that vision, and map it down into small enough pieces where you can begin to execute in a data-informed way.”
Integrating BI into Everyday Business Processes

BI as Your Daily Business Companion: Setup
Setting up a BI infrastructure where one does not exist can be a challenging endeavor. However, it’s as easy as collecting and inputting data using a trusted device and software platform.
The next phase is the integration of a business intelligence tool, like Microsoft BI®, and a software platform whereby your organization is enabled to report on the factors to which you wish to collect data. A powerful solution would be an application like 1st Reporting, both customizable and able to integrate with platforms like Microsoft Teams® and Microsoft BI®.
Implement procedures for your team to utilize field reporting features in 1st Reporting, decide which KPTIs matter for your needs, and start analyzing data.
Training and Culture: Ensuring BI Adoption

The successful adoption and effective use of Business Intelligence (BI) tools within a company largely hinge on comprehensive training and a supportive company culture. Let’s explore how these two factors play a critical role in how well the use of BI tools presents itself in organizations.
Training for BI Tools
Start with the Basics
Introduce your team to BI concepts with training that starts with the basics. Help them understand what BI is, why it’s essential, and how it can aid in decision-making.
You’ll need to tailor the depth of the training based on individual roles—some may need a deep dive into data analytics, while others might only need to understand how to read a dashboard.
Ongoing Education
As BI tools and technologies evolve, ongoing education is essential. Offer regular training sessions to cover new features and more advanced techniques. Consider having a knowledge base or a resource center where employees can access training material at their own pace.
Hands-On Experience
Encourage learning by doing and lead by example. Create opportunities for team members to work with accurate data and solve actual business problems. Hands-on experience is invaluable for understanding how to apply BI tools effectively.
Role-Specific Training
Different departments will use BI tools in ways that are unique to their functions. Sales teams may focus on tracking leads and conversion rates, whereas finance might delve into cost analysis. Ensure that training is relevant to the specific needs of each team within your organization for a homogenous integration.
Company Culture and BI Toos
Leadership Endorsement
Remember when I said to lead by example? The adoption of BI tools should be actively endorsed by leadership first. When executives use and advocate for BI, it sets a tone that data-driven decision-making is valued. Leaders should share success stories that resulted from BI insights to illustrate its value.
Data-Driven Mindset
Foster a company culture that appreciates data. Encourage teams to base their strategies and decisions on data rather than intuition alone. Recognize and reward data-driven achievements to reinforce this mindset.
Collaboration Across Departments
BI should not be siloed within specific departments. Promote a culture of collaboration where data insights are shared across teams, enhancing overall company performance and fostering a more unified approach to business challenges.
Support and Resources
Team members should feel supported in their use of BI tools. You’ll need to provide adequate resources, such as access to data analysts or technical support, to help them leverage BI tools effectively. A sense of support can significantly reduce the intimidation factor that sometimes comes with the adoption of new technology.
Fail-Safe Environment
Encourage an environment where it’s safe to experiment and fail. When employees are not afraid to test hypotheses and explore data, they can discover valuable insights without the fear of repercussions if their initial theories are incorrect.
Investing in comprehensive training and nurturing a culture that values data-driven insights helps organizations ensure that their investment in BI tools yields the highest returns. It is not just about having the right tools but also about having a team that can use them effectively and an environment that supports their optimal use.
The Data-Driven Last Word
To wrap up, let’s underscore the essential insights from our exploration of business intelligence (BI) and its transformative impact across various sectors.
Firstly, ensure the integrity of your data through a robust cleansing process. Set up a clear data quality plan, combine automated tools with manual reviews, and maintain regular updates. A meticulous approach to data management propels the effectiveness of BI tools.
Next, observe how BI serves as a linchpin in industry-specific applications. From retail to healthcare, finance to manufacturing, and beyond, BI tools are pivotal in enhancing operational efficiency and strategic decision-making.
Don’t forget the human aspect—training and company culture are foundational to the successful adoption of BI tools. Tailor education to roles, encourage hands-on practice and create a culture that values data-driven decisions backed by solid leadership endorsement.
Remember, a data-informed approach to business is not a luxury—it’s a necessity for those aiming to excel in today’s competitive landscape.
Now, take a moment to consider your own BI strategy. Are you leveraging your data to its fullest potential? Are your decision-making processes as informed as they could be? Reflect on the insights provided and explore where you can bolster your BI capabilities.
It’s your move—analyze, enhance, and execute. Let BI be the compass that guides your organization to new heights. If you haven’t already, begin your journey towards a more data-driven business environment today.
Article Sources
- Howarth, Josh. 2022. “20+ Business Intelligence (BI) Statistics for 2023.” Exploding Topics. Exploding Topics. December 23, 2022. https://explodingtopics.com/blog/bi-stats.
- Kašparová, Petra. 2022. “Intention to Use Business Intelligence Tools in Decision Making Processes: Applying a UTAUT 2 Model.” Central European Journal of Operations Research 31 (3): 991–1008. https://doi.org/10.1007/s10100-022-00827-z.
- “Know the Difference between Data-Informed and versus Data-Driven at Andrewchen.” 2022. Andrewchen.com. 2022. https://andrewchen.com/know-the-difference-between-data-informed-and-versus-data-driven/.